
Chronopotentiometry holds a constant current through the cell and records the potential the instrument has to apply to sustain it. Useful for studies of diffusion, surface coverage, and the charge-discharge behaviour of batteries and supercapacitors.
Note. Chronopotentiometry needs the galvanostat mode, which is only available on the ECA-LP1. The other ECA models can run amperometry and potentiometry but not chronopotentiometry. See device quickstart for the mode availability matrix.
How it works
The instrument sources a constant current I_applied and measures
the potential the cell takes to sustain it. As long as one
electroactive species can supply the imposed current at the
electrode surface, the potential sits on a plateau. When that
species depletes faster than diffusion can replace it, the
potential jumps to whatever level is needed to drive the next
available process. The result is a sharp transition between
plateaus. The shape of these transitions and the duration of
each plateau report on diffusion, surface coverage, and
reaction stoichiometry.

Parameters
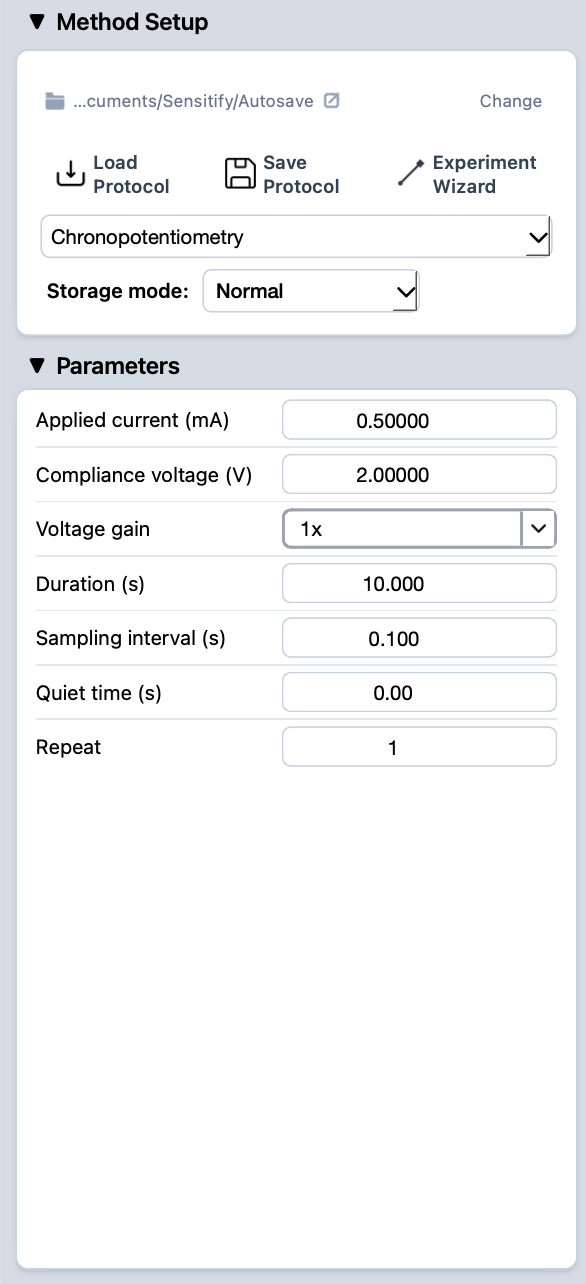
Applied current (mA)
- What
The constant current driven through the cell. Sets how hard the system is pushed and which physical regime dominates the response.
- Typical value
Sized to give a meaningful potential response within the duration. Too low gives a flat trace, too high may exceed the compliance voltage. Often picked from a prior CV or from estimates based on electrode area and analyte concentration.
- When to change
Raise to push the cell harder (higher overpotential, faster depletion); lower for cleaner plateaus and longer transitions.
Compliance voltage (V)
- What
Maximum potential the instrument is allowed to apply while trying to maintain the current setpoint. The cell impedance and the imposed current together set the demanded voltage; if the demand exceeds compliance, the run trips and the current is no longer enforced.
- Typical value
The full ECA-LP1 range (±5 V or ±7.5 V depending on configuration), unless you have a specific reason to clamp lower.
- When to change
Lower the compliance voltage to protect a sensitive cell from accidentally large excursions. Raise it when high-impedance cells need more headroom.
Voltage gain
- What
Front-end amplifier gain on the measured potential. Higher gain gives finer resolution at the cost of dynamic range.
- Typical value
The default, unless the expected potential range is much smaller or much larger than the default's full scale.
- When to change
Increase gain when the potential of interest is small (sub-100 mV) and resolution matters. Decrease when the potential could swing across a wide range.
Duration (s)
- What
Total length of the current step. Sets how much of the potential transient is recorded.
- Typical value
Long enough to see the plateau(s) of interest plus the transition(s) between them. Often tens of seconds to minutes; battery work can stretch to hours.
- When to change
Lengthen to follow slow transitions or wait for late processes. Keep short when only the first plateau matters.
Sampling interval (s)
- What
Time between recorded potential samples.
- Typical value
Milliseconds for sharp transitions; longer intervals for slow drift studies.
- When to change
Decrease to resolve fast transitions faithfully. Increase for long runs where only the slow evolution matters.
Quiet time (s)
- What
Pause before the current step is applied. Lets the cell settle at its open-circuit state before the experiment begins.
- Typical value
A few seconds.
- When to change
Raise it for slowly-equilibrating systems; drop to 0 when the cell is already at OCP.
Repeat
- What
Number of times to run the configured step back-to-back. Useful for averaging, for checking reproducibility, or for stress-test sequences.
- Typical value
1 for routine work; 3–10 for averaging or for cycling experiments.
- When to change
Raise to gather replicates or to stress a cell with repeated current pulses. Keep at 1 for one-shot diagnostics.
Running it
- Connect the cell. See cell & electrode setup.
- Pick chronopotentiometry from the Method Setup dropdown (only available on ECA-LP1) and fill in the parameters.
- Press the play button at the top-left of Studio. The Potentiogram tab opens automatically and the trace draws live.
- When the run finishes, the experiment appears in the right sidebar.
Reading the result
A chronopotentiometric trace shows the potential the cell needs to sustain the imposed current. Stable plateaus indicate one dominant electroactive species; sharp steps mark the transition to the next available process when the previous one depletes at the surface.
For closer inspection of a specific region of the transient, use the marquee zoom in the plot toolbar. To compare multiple runs, leave them all visible in the right sidebar.