
Peak finding picks out the local maxima and minima on a voltammogram and reads off their potential and current. Studio runs it in one click on any voltammetry experiment in the right sidebar.
How it works
Studio scans the voltammogram for local maxima (anodic peaks, where the current is at a maximum within a window) and minima (cathodic peaks, at a minimum), records the potential and current at each one, and overlays markers on the plot. A single baseline and detection rule run in the background.

Peak finding is the same one-click action on every voltammetry experiment. Studio places the markers automatically; the Pk window then lets you adjust them.
Run peak finding
In the right sidebar, every voltammetry experiment carries a Pk badge next to its name. Click it.
Studio sweeps the trace, picks out the peaks, and overlays markers on the plot at the detected positions. The Pk badge stays highlighted while the markers are applied and greys out when the peaks are cleared.
Studio detects the peaks in one click. The Pk window then lets you fine-tune the result, nudging the detected peaks where you need them.
The full action recorded on a CV trace:
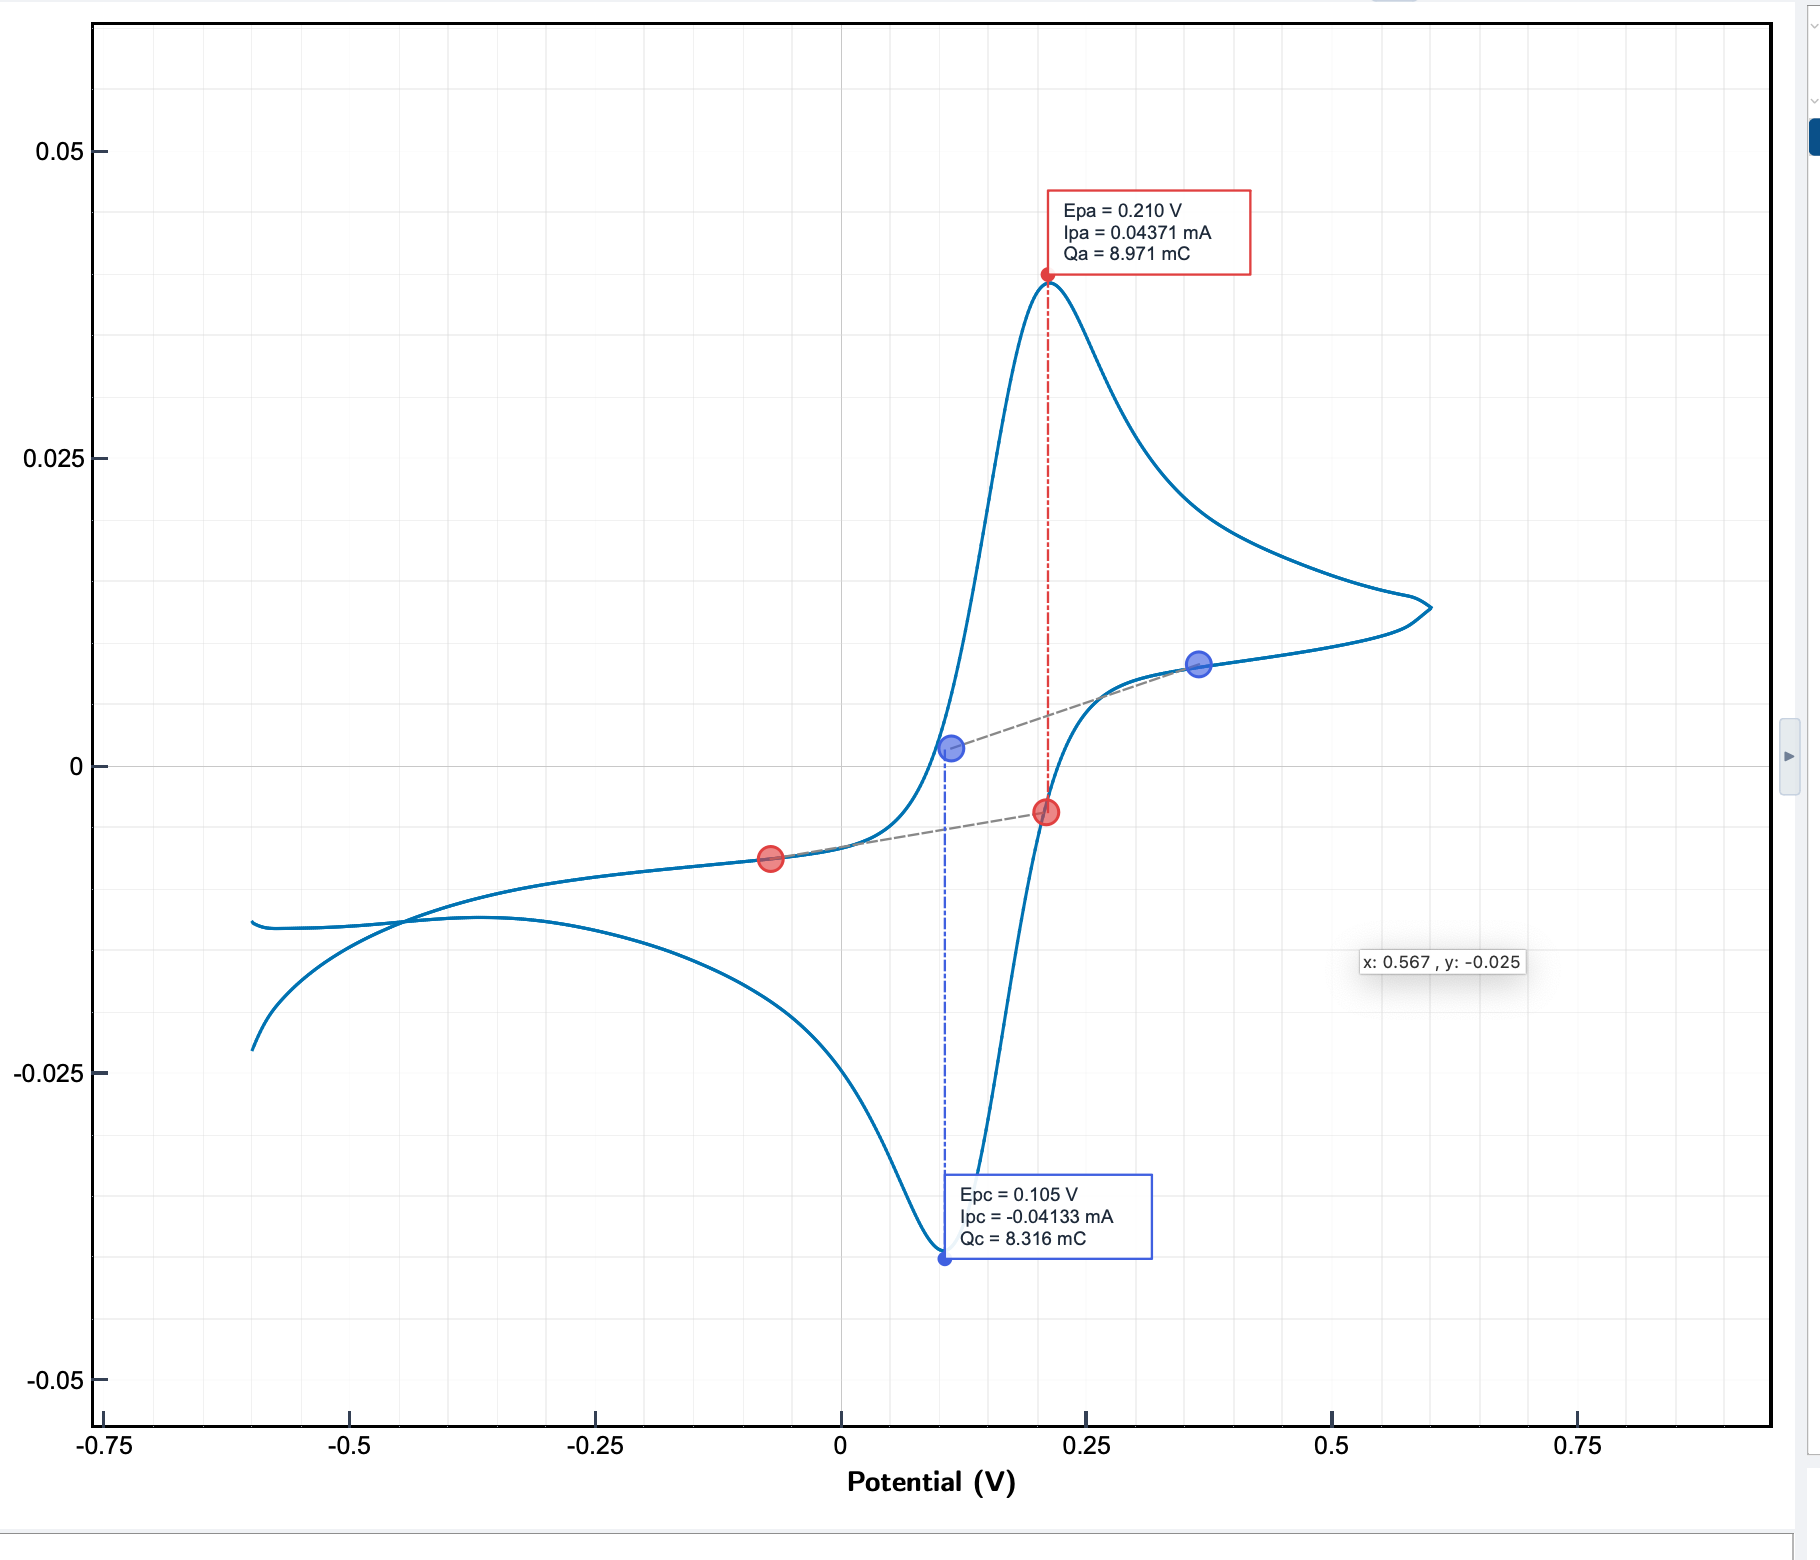
Click the Pk badge → markers and Epa / Ipa / Qa values appear on the trace.
What Studio finds
For every detected peak you get:
- The potential at the peak position, in V (
Epafor anodic peaks,Epcfor cathodic peaks). - The current at the peak (
Ipa,Ipc), in A or mA depending on the current range used during the measurement. - The charge under each peak (
Qa,Qc), automatically integrated above a baseline Studio detects between the peak and its neighbouring inflection points. See integrate a peak for what the Q values mean and how to use them.
Forward-sweep and reverse-sweep peaks are marked separately when both are present.
Reading the results
Peak values appear next to their markers on the plot and in the experiment's entry in the right sidebar. Hover or click a marker to highlight a single peak.
For converting the auto-computed Q values into surface
coverage, coulombic efficiency, or deposited mass, see
integrate a peak.