
Sensitify Studio is the desktop app you use to run experiments and look at results. The window has three panes: controls on the left, the plot in the middle, and the experiments list on the right.
The window at a glance
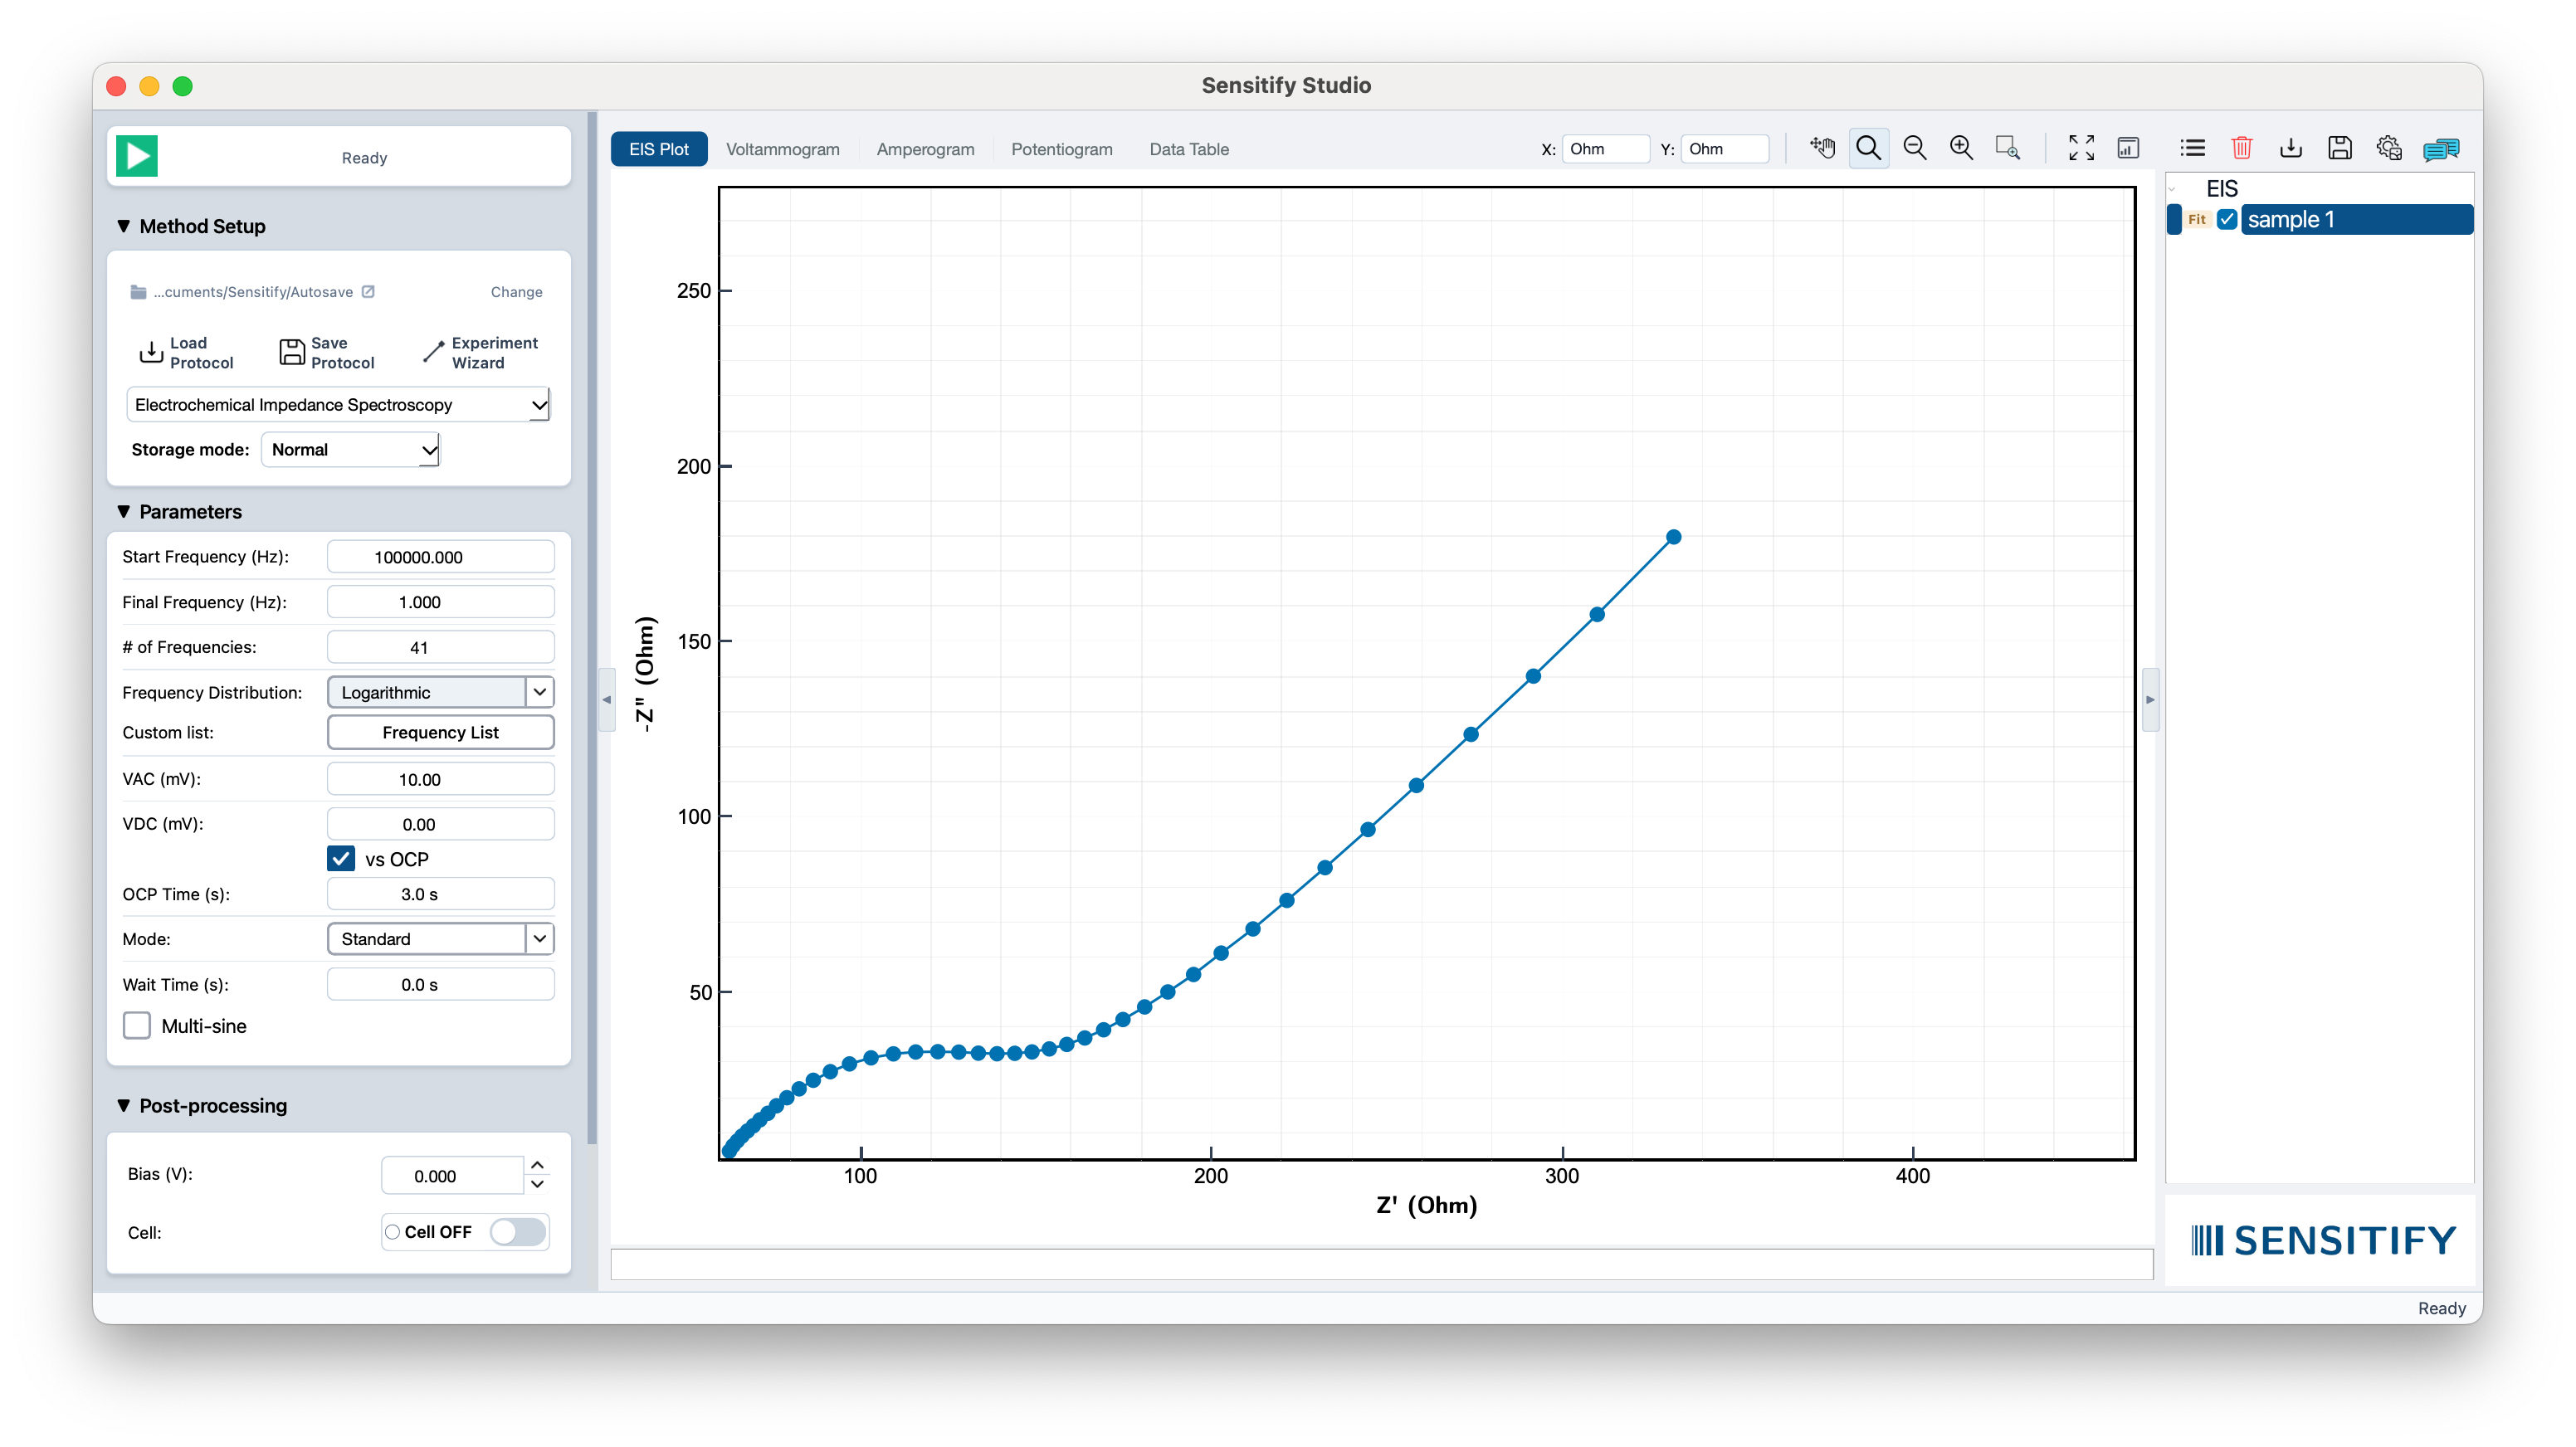
- Top-left. Instrument status and the play button to run an experiment.
- Left sidebar. Set up the technique, edit its parameters, configure post-processing, and check the device.
- Centre. The plot area, with tabs for EIS, voltammogram, amperogram, potentiogram, and the raw data table.
- Right sidebar. The list of experiments in the current session, grouped by technique.
- Bottom-right. A short status line.
The two side panels collapse via the small chevrons on their inner edges if you want more room for the plot.
Left sidebar
Four sections, top to bottom.
Method Setup
Pick the technique from the dropdown: EIS, CV, and the others. Above the dropdown is the autosave folder for the current session; click Change to point Studio somewhere else. The Load Protocol and Save Protocol actions write the full method and parameters to a file you can reuse later. Experiment runs the configured measurement.
Parameters
The fields here change with the technique. EIS shows start and final frequency, number of points, AC and DC amplitudes, and mode. CV shows the vertex potentials, scan rate, number of scans, and current range. Whatever the technique needs.
Post-processing
Settings that apply after a run, for example DC bias and keeping the cell on or off between scans.
Device
The connected instrument: model, port, and firmware version. If no instrument is attached, the panel reads as disconnected.
Plot area
Two rows sit above the plot. The top row is the tab bar: it switches between plot types and carries the Workbench button at its right edge, which opens the Publication Workbench. The row below is the toolbar, where the plot tools are grouped left to right by purpose and separated by thin dividers.
The tabs switch between:
- EIS Plot. A Nyquist | Bode segmented control appears in the toolbar while this tab is active, so the current view is always clear. Nyquist is the complex-plane plot; Bode shows magnitude and phase against frequency.
- Voltammogram. Current vs. potential.
- Amperogram. Current vs. time.
- Potentiogram. Potential vs. time.
- Data Table. The raw rows behind whichever experiment is selected.
The X and Y unit pickers set the axis units within a plot type. The view tools beside them pan, zoom in and out, marquee-zoom, and fit to window. Four one-click buttons handle common plot operations:
- Screenshot. Save the current plot as PNG, PDF, or JPEG.
- Grid. Show or hide the grid lines.
- Log scale. Switch the X axis between linear and logarithmic.
- Legend. Show or hide the plot legend.
Grid, Log scale, and Legend stay pressed while they are on, and all four reflect the active plot, so switching tabs updates them to match that plot's settings. The trash icon clears the selected experiment; the save and export icons write the current view out as a file (see Export for publication).
Right sidebar: experiments
Every measurement you take is added to the right sidebar, grouped under its technique header (EIS, Voltammetry, and so on).
- The checkbox beside each experiment shows or hides its trace in the plot.
- A Fit badge appears next to EIS experiments. Click it to run a circuit fit; it stays highlighted while the fit is applied and greys out when no fit exists.
- A Pk badge does the same for peak finding on voltammograms.
Multiple experiments can be visible at once for direct comparison, as long as they share a plot type. To work on several together, Cmd/Ctrl-click adds or removes one experiment from the selection, Shift-click selects a range, and Cmd/Ctrl + A selects every experiment in the list. Useful for restyling or comparing many traces at once.
Top and bottom bars
The top-left of the window shows the connected instrument (or No device) next to a play button. Press play to run the experiment as configured in the left sidebar.
The bottom-right shows the application status: Ready, Running, Saving, and so on.