
Studio reports the charge under each peak alongside its position and height. The integration runs automatically as part of peak finding. The same one-click Pk action produces the markers, the baseline, and the Q values together.
How it works
When peak finding runs on a voltammogram, Studio detects the
inflection points around each peak, draws a baseline between
them, and integrates the area between the trace and that
baseline. The result is the charge Q (in coulombs or
millicoulombs) that flowed during the redox process. This is
the time integral of current through the peak window:
Q = ∫ i dt over the peak.
Studio reports Qa next to the anodic peak and Qc next to
the cathodic peak in the same annotation tooltip that holds
Epa / Ipa and Epc / Ipc.
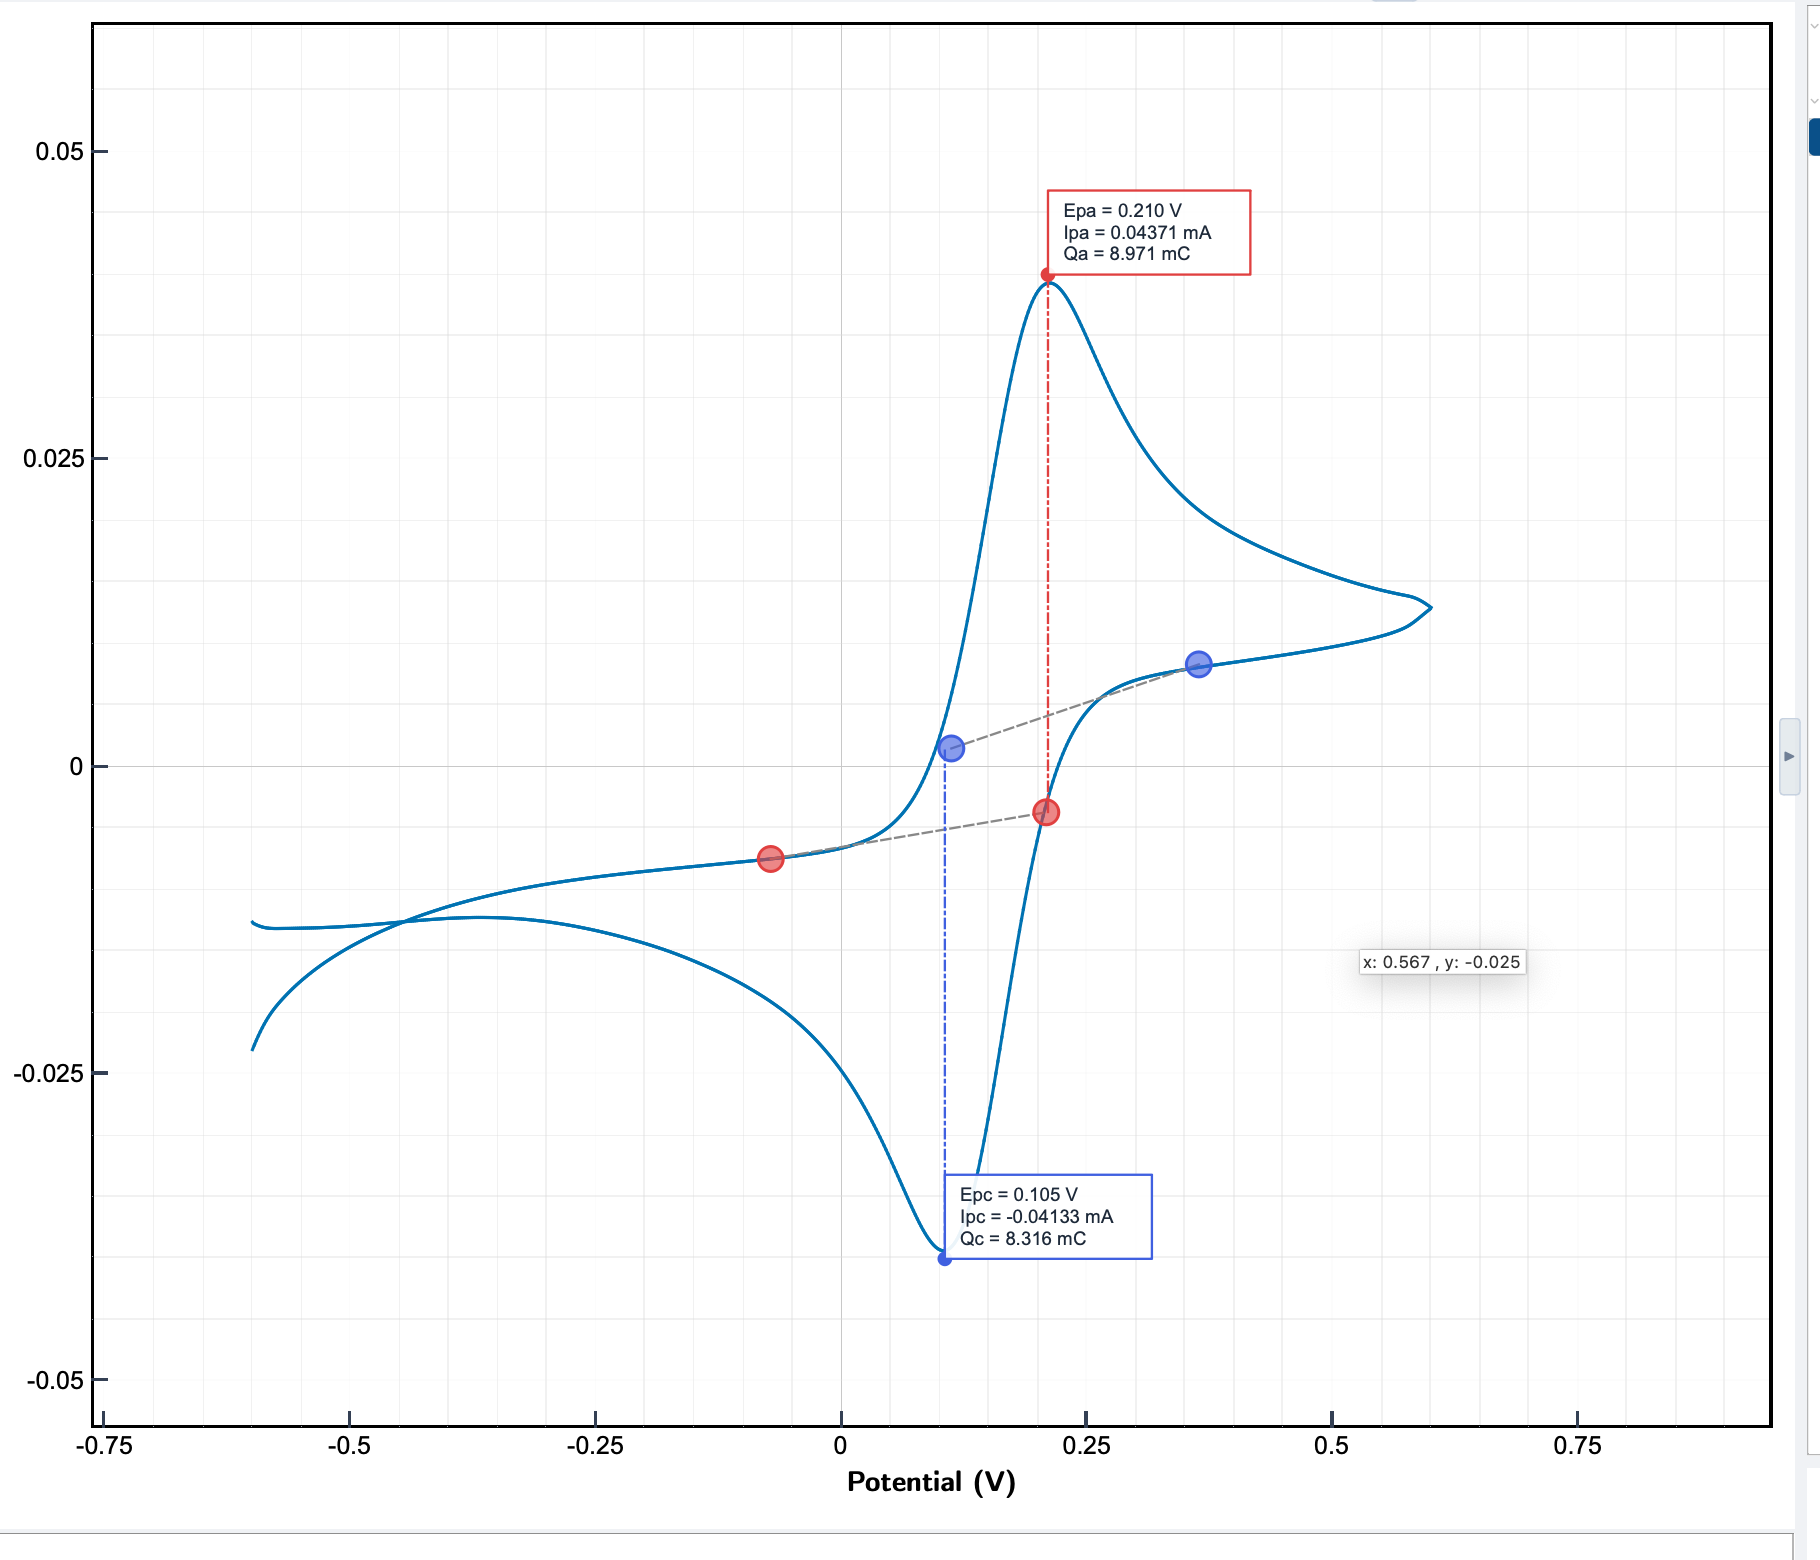
The blue dots on the trace mark the baseline endpoints Studio picked. The dashed line from each peak to its baseline visualises what was integrated. There are no knobs. The baseline detection runs automatically.
What Q tells you
Charge connects directly to the amount of material that reacted through Faraday's law:
n = Q / (z · F)
where n is the moles of analyte oxidised or reduced at the
peak, z is the number of electrons per molecule, and F is
the Faraday constant (96 485 C/mol).
Common applications:
- Surface coverage. For an adsorbed redox-active species,
divide
Qby the electrode area and(z·F)to get coverage in mol/cm². - Coulombic efficiency. For a reversible couple, the ratio
|Qc / Qa|should be close to 1. Lower values point at side reactions, decomposition, or analyte loss between sweeps. - Deposited mass. Multiply
nby the molar mass to get the mass of metal plated, polymer formed, or oxide grown.
Reading the result
The Q values appear in the same tooltip as the peak position and height. The values integrate directly into the peak tooltip. To copy the numbers out, hover over the marker; the tooltip stays open while you read.
For closer inspection of the baseline placement, use the marquee zoom in the plot toolbar to enlarge the peak region. If the baseline looks wrong (Studio picked the wrong inflection points because of overlapping processes or noise), the integration value will be biased. Clean up the trace with data processing and re-run Pk, or contact support if the placement still looks off.