
The export format, the axis ranges, and the metadata you keep are decided before you save. This page covers each choice.
This page covers single-experiment export from the plot toolbar. For multi-experiment figures (calibration curves, Tafel plots, multi-panel composites), see the Publication Workbench.
Pick the right format
The save icon in the plot toolbar opens a small menu with the options Studio offers:
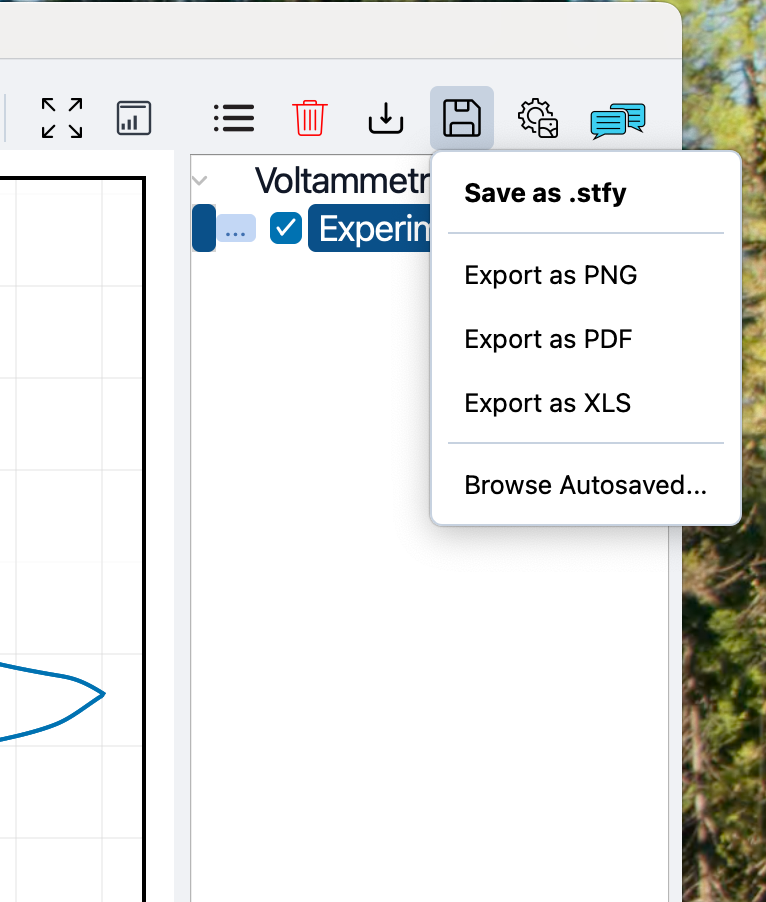
- Save as .stfy. The native format. Carries the trace data, every parameter, the instrument model, the firmware version, and the timestamp. Use this whenever you might want to re-open the experiment in Studio later.
- Export as PDF. Vector output, for figures that will appear in a manuscript. Axes and traces stay sharp at any size.
- Export as PNG. Raster output. Use it for slide decks, posters, or anywhere the publisher asks for a raster image rather than vector.
- Export as Excel (.xlsx). The raw data plus a metadata sheet, for tables and supplementary material.
- Export as CSV (.csv). Comma-separated columns with a metadata header, for Python, R, Origin, and spreadsheets.
- Export as ASCII (.txt). Tab-separated columns of the raw data, for legacy instruments or any tool that parses tabular text.
- Export as MATLAB (.mat). The raw data as a .mat file, for loading directly in MATLAB.
- Browse Autosaved. Opens the autosave folder so you can recover an experiment Studio recorded without you saving it by hand.
Copy straight to the clipboard
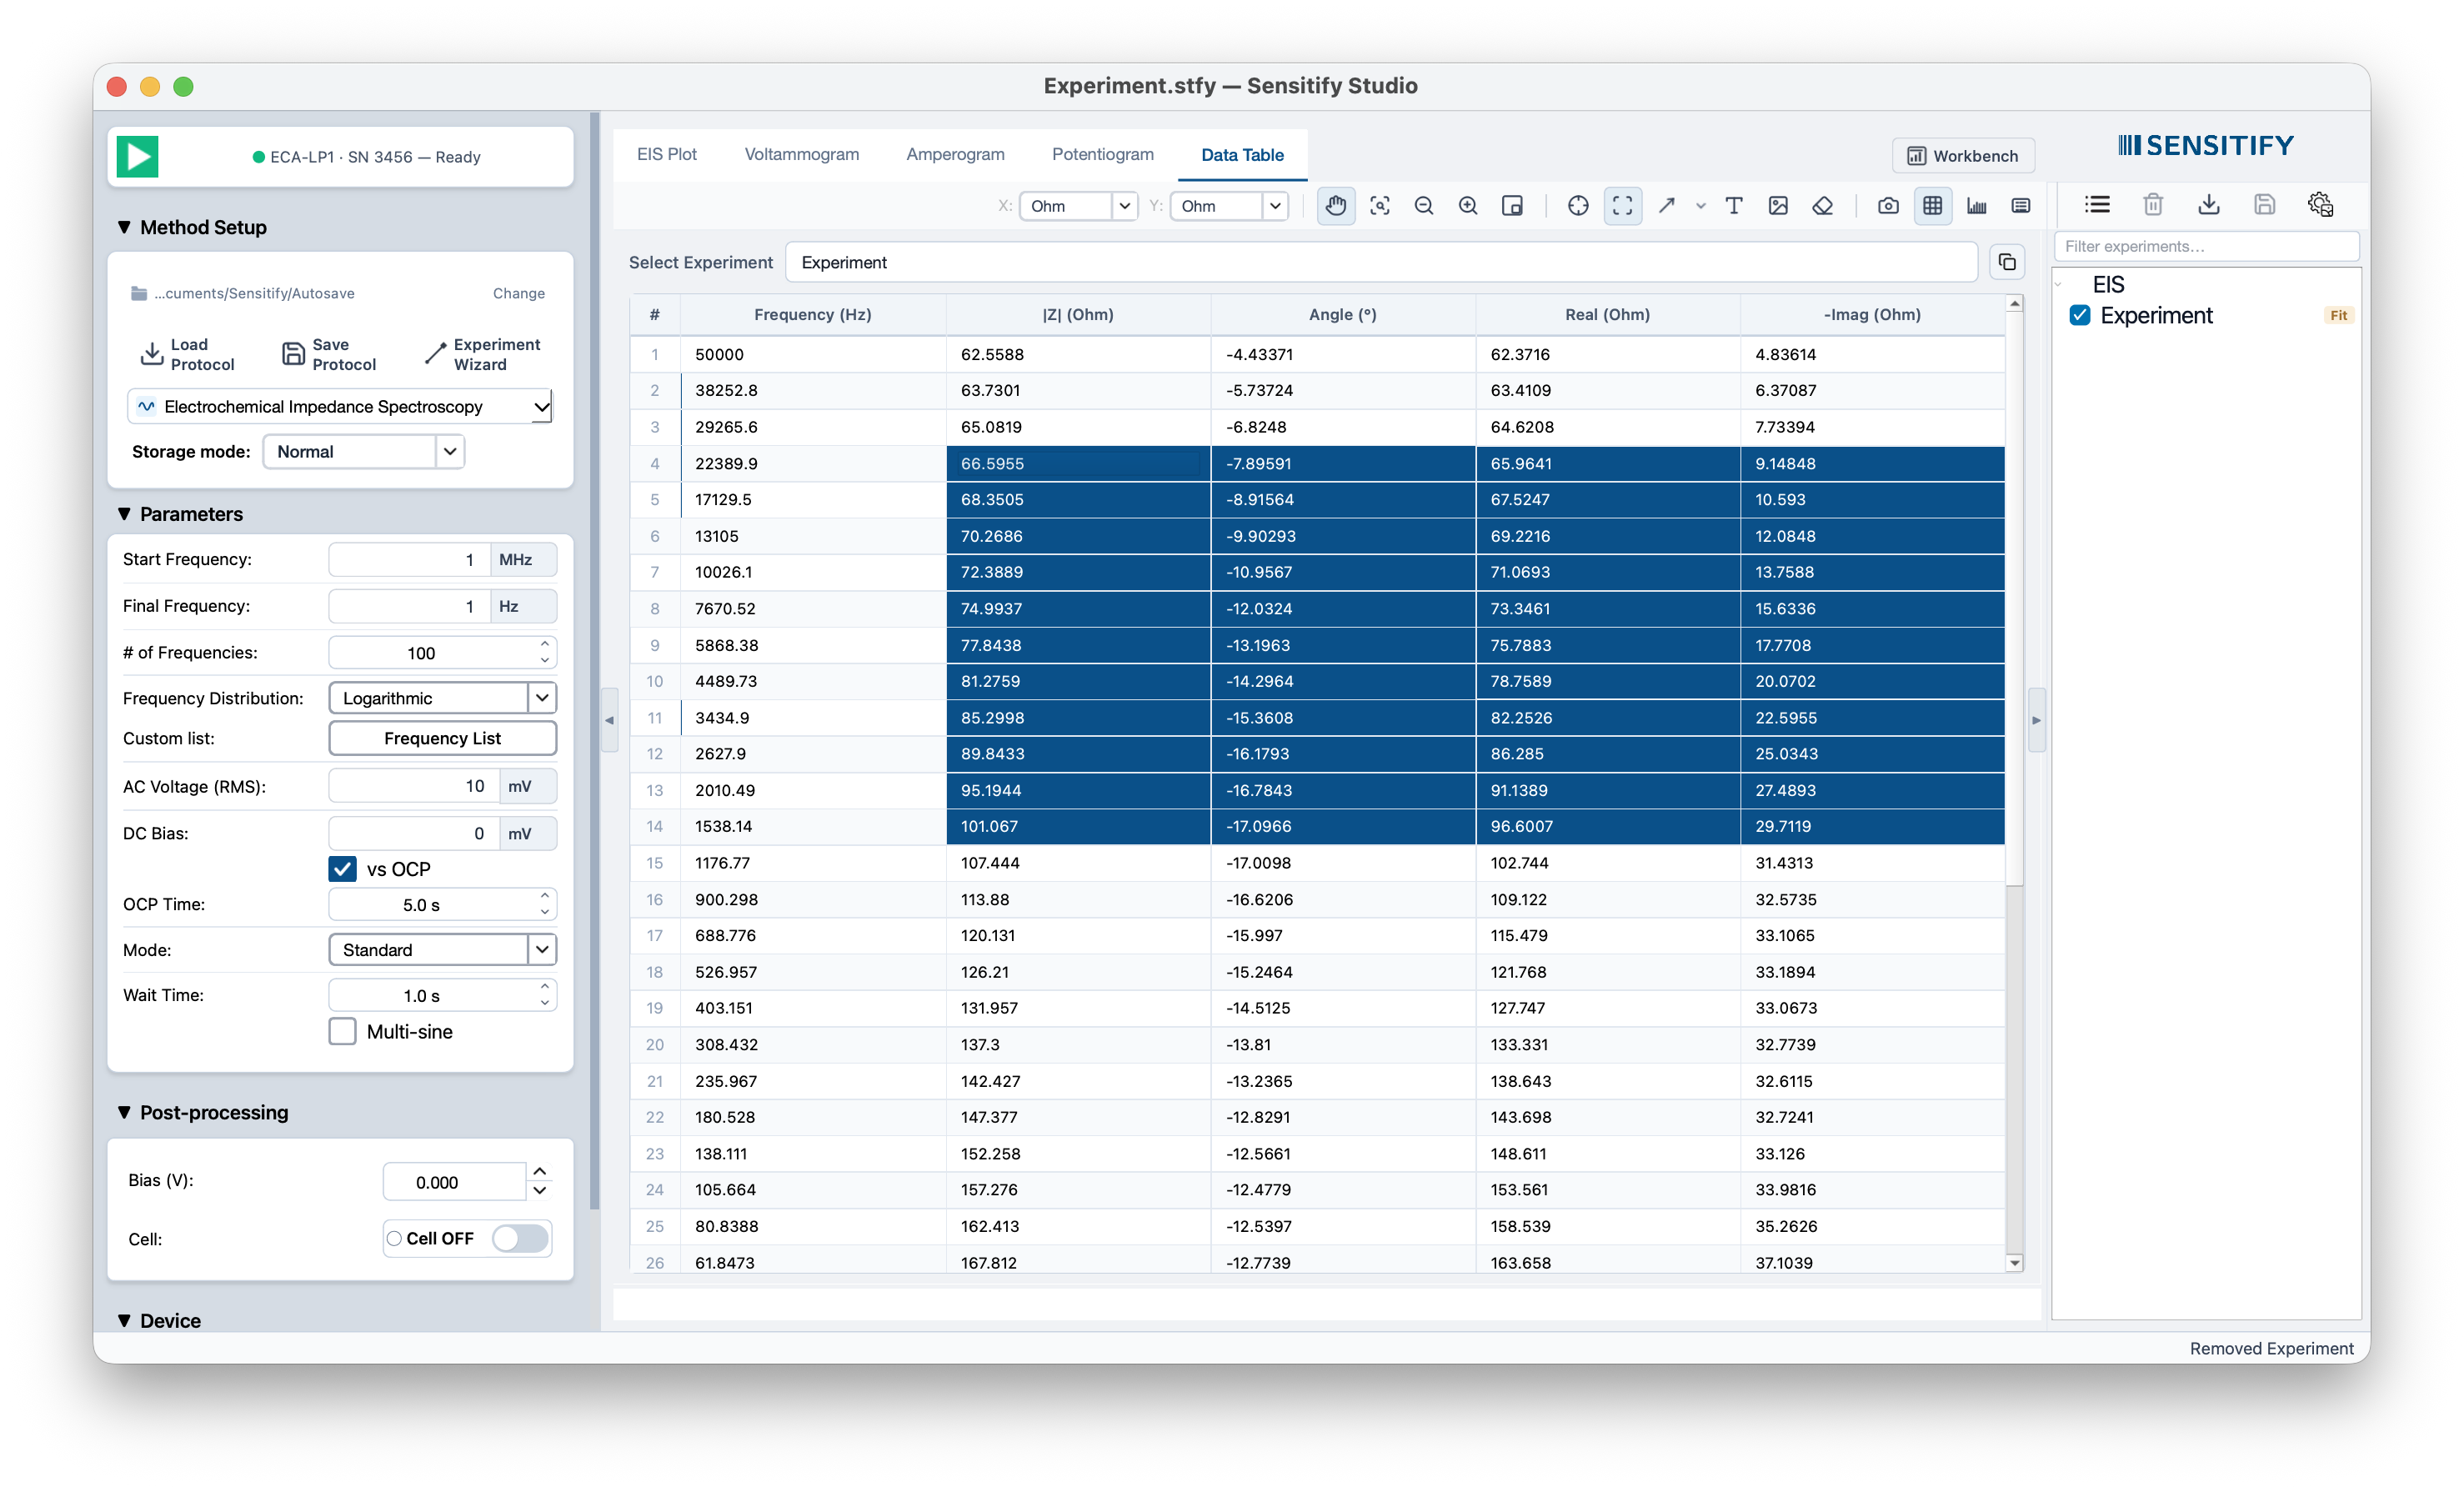
For a figure headed into a document rather than a file on disk, press Cmd+C (macOS) or Ctrl+C (Windows) while a plot tab is active. Studio copies the plot as a 2× resolution image to the clipboard, ready to paste into Word or PowerPoint. The same action is on the right-click menu of every plot as Copy to Clipboard.
Lock axis ranges across figures
If you're comparing multiple experiments across separate figures (for example, the same redox couple in different electrolytes), set the X and Y axis ranges by hand before exporting each one so they share a common scale.
The X and Y unit pickers in the plot toolbar let you type the range you want. Apply the same range to every figure that should be visually comparable, then export each.
Record what you need for reproducibility
The Excel export carries the experiment metadata (parameters, instrument model, firmware version, timestamp) on a separate sheet. Include that file as supplementary material.
The native .stfy file carries the same information and can be re-opened in Studio later; share it alongside the Excel file if collaborators have Studio installed.